Bringing Data to Life
Once you have your geographic data in GeoJSON format, rendering it beautifully in the browser is straightforward thanks to modern mapping libraries.
Choosing a Library
- Leaflet.js: Lightweight, easy to learn, perfect for simple maps and smaller GeoJSON datasets (under 10,000 features). Uses DOM elements (SVG/Canvas) to render.
- MapLibre GL JS / Mapbox GL JS: WebGL-accelerated. Incredibly fast, capable of rendering millions of points smoothly. Requires data to be styled using layers and sources rather than iterating over arrays.
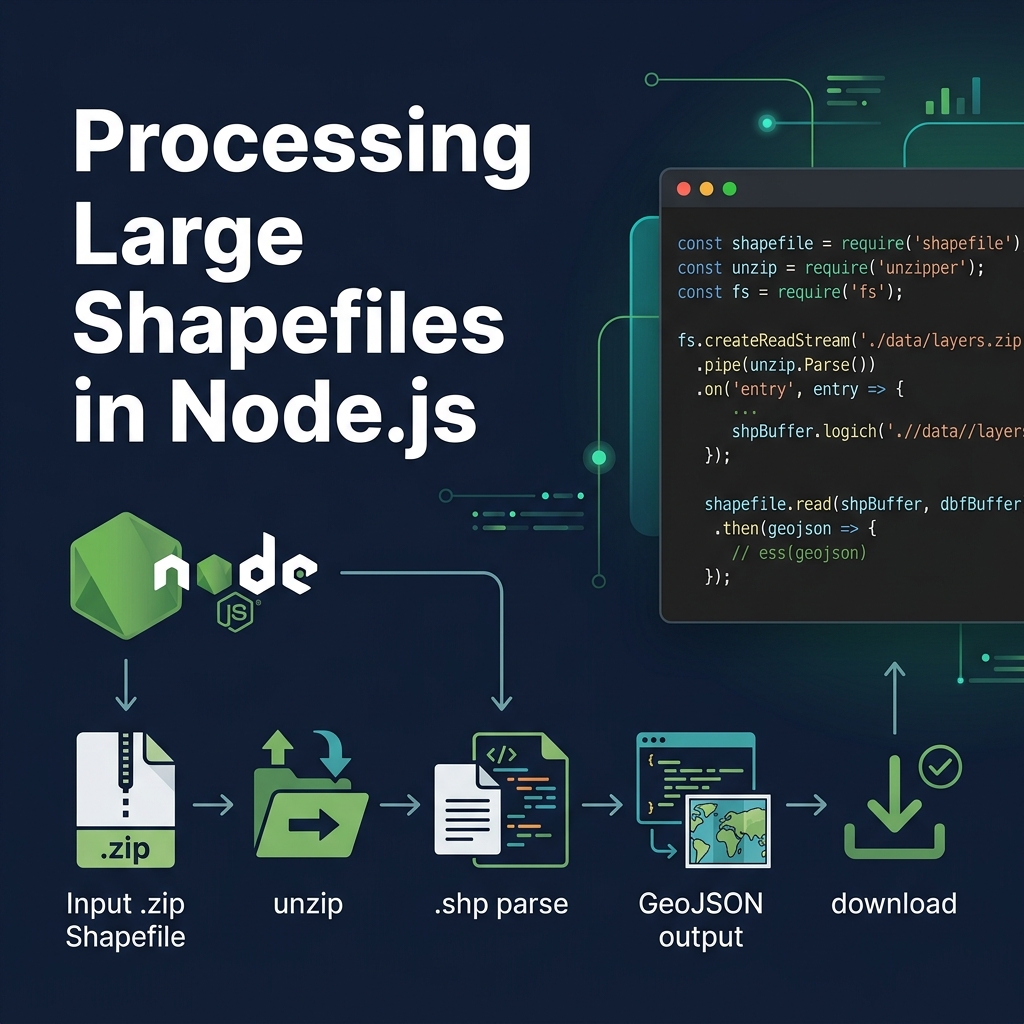
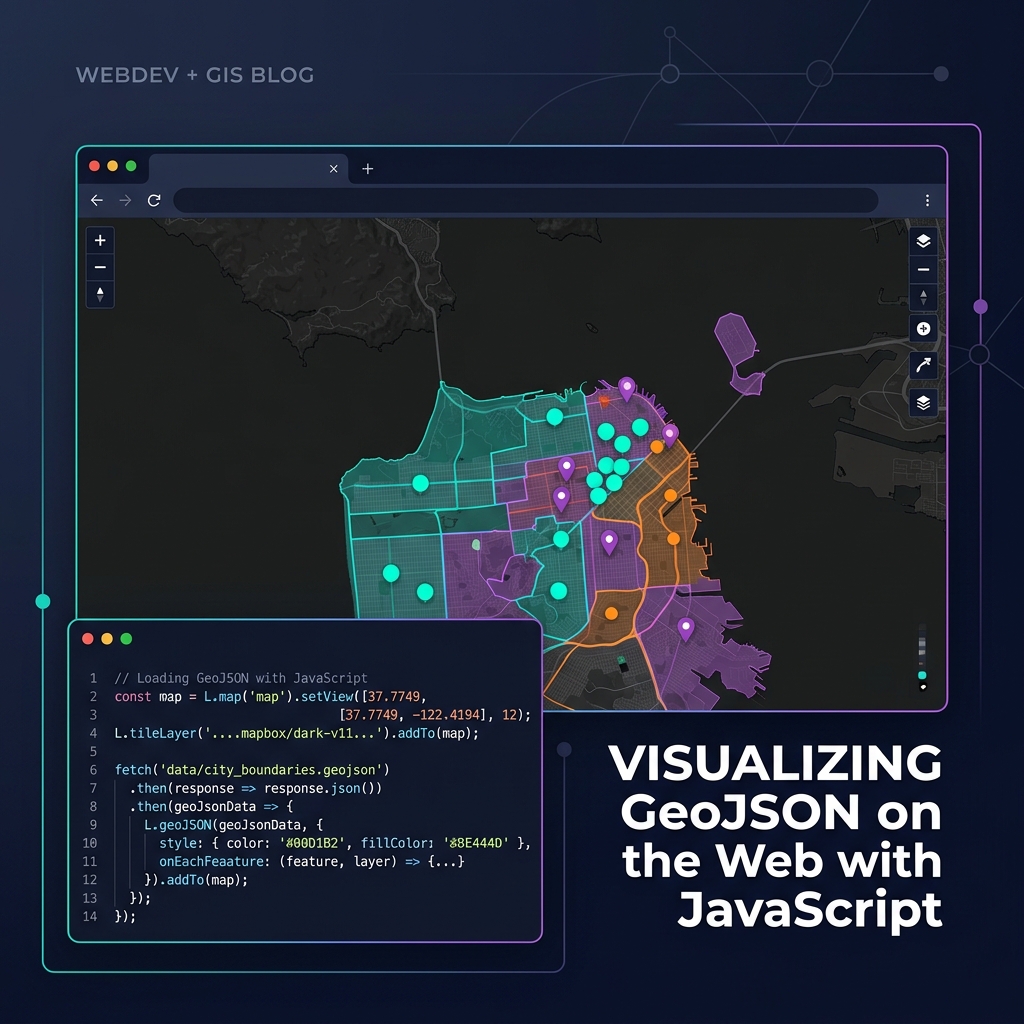
A Simple MapLibre Implementation
Here is how you add a GeoJSON source and a polygon layer using MapLibre:
const map = new maplibregl.Map({
    container: 'map', // HTML div id
    style: 'https://demotiles.maplibre.org/style.json',
    center: [-74.006, 40.712], // Longitude, Latitude
    zoom: 10
});

map.on('load', () => {
    // 1. Add the GeoJSON as a data source
    map.addSource('my-data', {
        'type': 'geojson',
        'data': 'https://example.com/data.json'
    });

    // 2. Add a visual layer connected to the source
    map.addLayer({
        'id': 'polygons-fill',
        'type': 'fill',
        'source': 'my-data',
        'paint': {
            'fill-color': '#088',
            'fill-opacity': 0.6
        }
    });
});
For large datasets, always consider converting your GeoJSON into Vector Tiles (e.g., using Tippecanoe) before serving them to the client!